Skip to content

Seattle Bubble

local real estate news, statistics, and commentary without the sales spin.

Menu
  • Home
  • About
  • Contact
  • Reference
  • Speaking
Menu

New listing absorption falls to a seven-year low

Posted on June 7, 2018 by The Tim

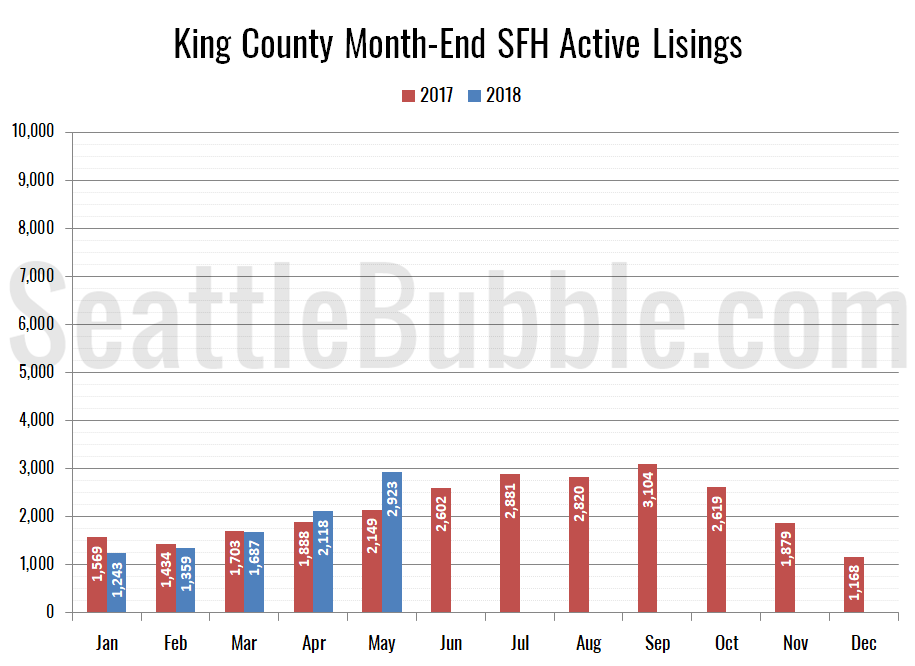
The big increase in listings is the first interesting development we’ve seen in the local real estate market in months, so here are a few alternative takes on recent home listing activity.

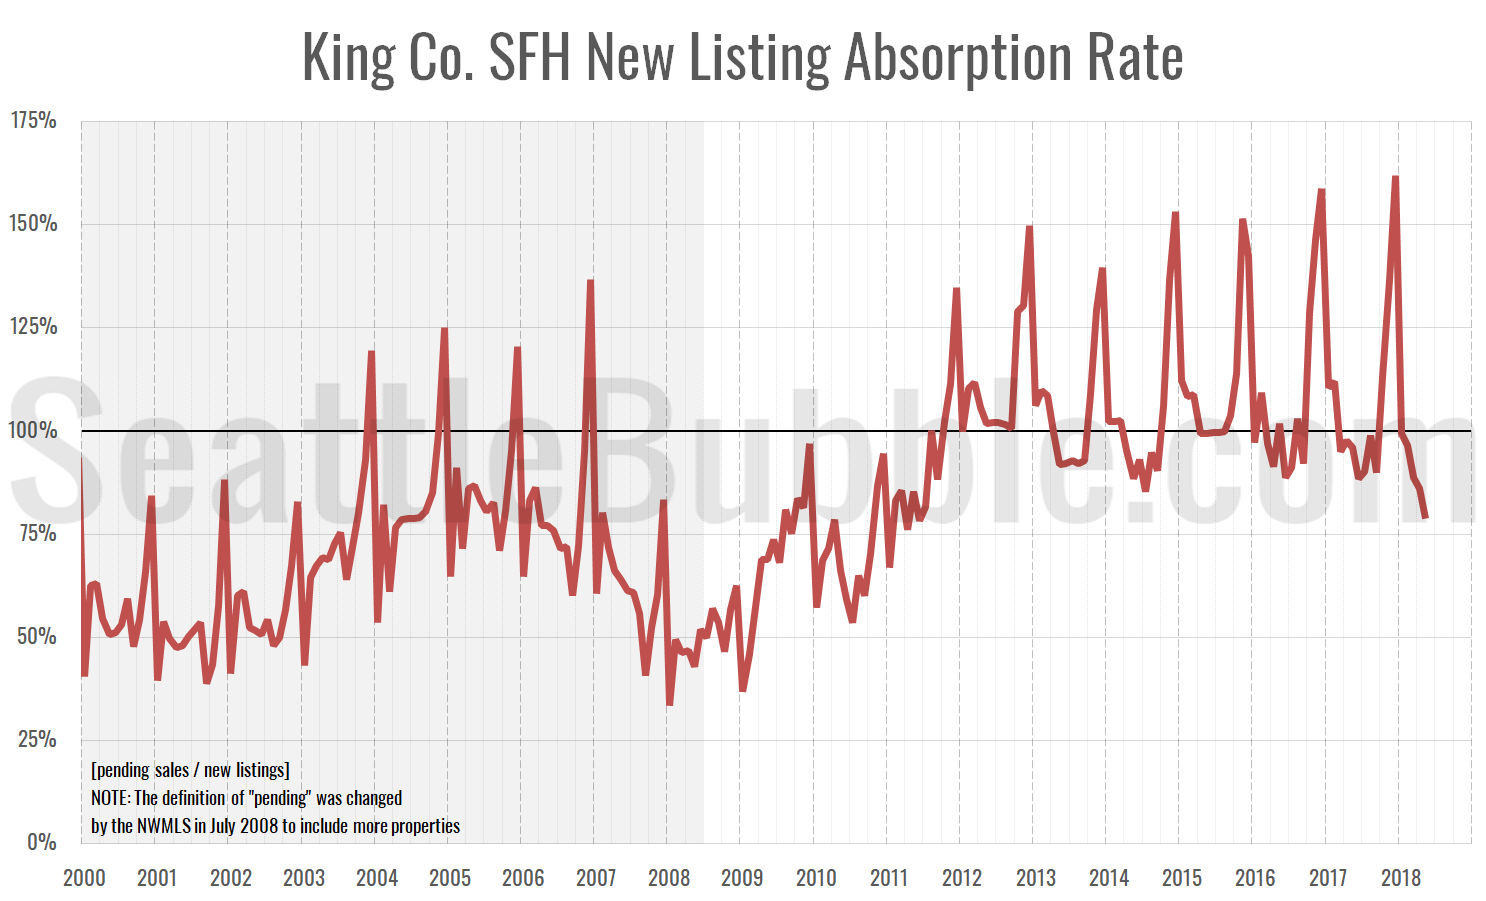
First up, here’s a chart of new listing absorption. This is a simple look at the ratio of pending sales to new listings. If more homes are going pending in a month than there are being listed, this ratio goes above 100 percent, which is obviously not great for buyers.

As of May, the absorption metric has dropped to 79 percent—its lowest level since June 2011. Interestingly, the rate was at its all-time highest level just last December at 162 percent. The absorption rate typically hits its lowest point of the year in June or July, so seeing it drop this low this fast is highly unusual.

Share:

  • Twitter
  • LinkedIn
  • Facebook
  • Reddit
  • Pinterest
  • Email

NWMLS: New listings hit highest point since 2007 as inventory finally grows

Posted on June 5, 2018June 5, 2018 by The Tim

May market stats have been published by the NWMLS, but their press release isn’t out yet, so let’s just dive into the numbers.

The big news in this month’s numbers is the big bump in both new listings and total on-market inventory. The last time we had more than 4,000 new single-family listings in a single month in King County was July 2007.

Share:

  • Twitter
  • LinkedIn
  • Facebook
  • Reddit
  • Pinterest
  • Email

May Stats Preview: Sudden Listings Surge?

Posted on June 4, 2018 by The Tim

Yes, it has been over a month since the last update here. What is there to say when the market is the same frenzied nonsense day after day, week after week, month after month? It’s exhausting, and I’m not even in the market to buy a home. If you are, you definitely have my pity.

Even when I’m not posting here, I am still keeping my spreadsheets up to date and sharing them with those who support my ongoing work as members of Seattle Bubble.

Anyway, I’m back because there’s something definitely interesting in our regular monthly “preview” charts for May. Unless something has really broken in my data collection, it looks like we’re seeing a sudden surge of listings begin to pile up.

Share:

  • Twitter
  • LinkedIn
  • Facebook
  • Reddit
  • Pinterest
  • Email

Case-Shiller: Seattle home prices rising fastest in the nation

Posted on April 24, 2018 by The Tim

Let’s have a look at the latest data from the Case-Shiller Home Price Index. According to February data that was released this morning, Seattle-area home prices were:

Up 1.7 percent January to February
Up 12.7 percent year-over-year.
Up 23.9 percent from the July 2007 peak

Over the same period last year prices were up 1.8 percent month-over-month and year-over-year prices were up 12.1 percent.

Seattle leads the nation in both year-over-year and month-over-month home price growth. The only other metro areas with double-digit price growth from a year earlier are Las Vegas at 11.6 percent and San Francisco at 10.1 percent.

Share:

  • Twitter
  • LinkedIn
  • Facebook
  • Reddit
  • Pinterest
  • Email

Reader Comment: “Now all I seem to be able to afford are the meth houses!”

Posted on April 19, 2018 by The Tim

A reader going by the handle “JustSomeDude” left a comment this morning that is worth highlighting:

Came upon this website a couple months ago and find everyone’s perspectives interesting. I see a lot of wondering on what potential regular, non-speculating, non-investor sellers and buyers are thinking and doing. People who just want to live in a nice house.

I can’t speak for others, but I can share my thoughts / experiences recently as well as some anecdotal stories…

Share:

  • Twitter
  • LinkedIn
  • Facebook
  • Reddit
  • Pinterest
  • Email

Posts navigation

  • Previous
  • 1
  • …
  • 11
  • 12
  • 13
  • 14
  • 15
  • 16
  • 17
  • …
  • 717
  • Next

Tim’s Other Projects

Dispatches from the Multiverse

Current Market Stats

Charts courtesy Altos Research
Real Estate Market Chart by Altos Research www.altosresearch.com

Real Estate Market Chart by Altos Research www.altosresearch.com

Real Estate Market Chart by Altos Research www.altosresearch.com

Real Estate Market Chart by Altos Research www.altosresearch.com

News Categories

  • News (1,253)
    • Local (223)
    • National (46)
    • International (1)
    • Audio & Video (60)
    • Humor (43)
    • Opinion (88)
    • Uncategorized (314)
  • Features (558)
  • Statistics (1,109)
    • Counties (724)
    • Neighborhoods (100)
  • Economy (74)
  • Extras (491)
    • Polls (381)
    • Flickr Group (1)
    • Announcements (38)
    • Administrative (78)

Archives

Tip Jar

Like what we're doing?

Drop us a tip!

Accounts

  • Log in
  • Entries feed
  • Comments feed
  • WordPress.org
©2024 Seattle Bubble | Built using WordPress and Responsive Blogily theme by Superb