Skip to content

Seattle Bubble

local real estate news, statistics, and commentary without the sales spin.

Menu
  • Home
  • About
  • Contact
  • Reference
  • Speaking
Menu

Affordability Index Falls To Early 2005 Levels

Posted on April 18, 2017April 21, 2017 by The Tim

With all of the first quarter behind us, and the question of whether or not we’re in another real estate bubble here in Seattle on everyone’s minds, let’s take an updated look at our affordability index charts for the counties around Puget Sound.

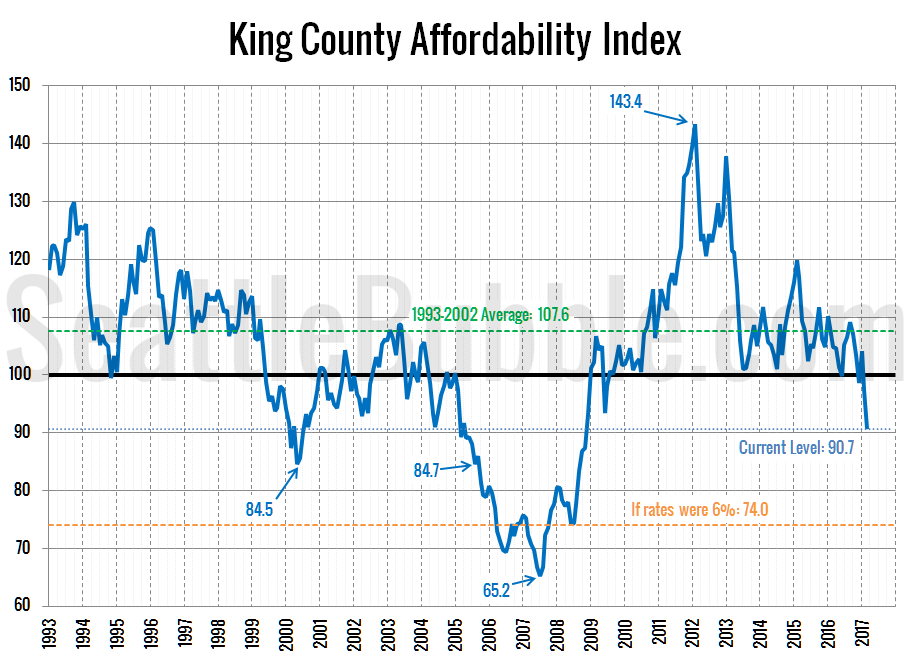
As of March, affordability has now fallen to its lowest level since November 2008, and as has been the case for quite a while, it would be considerably worse if not for the current absurdly low interest rates.

Median home prices have already begun their annual spring bump, while interest rates have ticked up slightly. The affordability index for King County currently sits at 90.7.

Share:

  • Twitter
  • LinkedIn
  • Facebook
  • Reddit
  • Pinterest
  • Email

I Love Getting Fan Mail!

Posted on April 13, 2017April 13, 2017 by The Tim

I love it when I get fan mail. Here’s a delightful message that a thoughtful reader sent me yesterday:

You are a f███ing idiot. You are like the rest of the broken clock con artists that keep preaching doom…

Share:

  • Twitter
  • LinkedIn
  • Facebook
  • Reddit
  • Pinterest
  • Email

NWMLS: Median Price Surges As Pending Sales Slip

Posted on April 10, 2017April 10, 2017 by The Tim

February market stats have been published by the NWMLS this week…

For the second month in a row, the only “good news” for buyers in this month’s numbers is the year-over-year decline in pending sales. Interestingly, although pending sales have been down year-over-year for two months in a row now, closed sales continued to increase year-over-year…

Share:

  • Twitter
  • LinkedIn
  • Facebook
  • Reddit
  • Pinterest
  • Email

March Stats Preview: Sales Just As Strong As Last Year

Posted on April 4, 2017April 5, 2017 by The Tim

March is behind us, so let’s take a look at the local housing market stats for the month. Short story: Despite listings 20 to 30 percent lower than last year, sales are coming in at or above where they were last year. Looks like spring is shaping up to be a ridiculous homebuying frenzy.

Sales shot up nearly 40 percent between February and March in both counties. Listings also increased month-over-month, but by far less.

Share:

  • Twitter
  • LinkedIn
  • Facebook
  • Reddit
  • Pinterest
  • Email

Case-Shiller Tiers: January Sets Up Another Strong Year

Posted on March 31, 2017April 5, 2017 by The Tim

It is a little late for this but it’s been a few months so I wanted to make sure we posted the update on Case-Shiller’s three price tiers.

Let’s check out the three price tiers for the Seattle area, as measured by Case-Shiller. Remember, Case-Shiller’s “Seattle” data is based on single-family home repeat sales in King, Pierce, and Snohomish counties.

Note that the tiers are determined by sale volume. In other words, 1/3 of all sales fall into each tier. For more details on the tier methodologies, hit the full methodology pdf. Here are the current tier breakpoints:

  • Low Tier: < $334,320 (down 0.2%)
  • Mid Tier: $334,320 – $532,269
  • Hi Tier: > $532,269 (down 0.1%)

All three tiers are increasing month-over-month, and look to be setting up another year of big price increases.

Between December and January, the low tier increased 0.5 percent, the middle tier rose 0.5 percent, and the high tier was up 0.5 percent. Somehow this translates to an overall increase of 0.6 percent.

Share:

  • Twitter
  • LinkedIn
  • Facebook
  • Reddit
  • Pinterest
  • Email

Posts navigation

  • Previous
  • 1
  • …
  • 22
  • 23
  • 24
  • 25
  • 26
  • 27
  • 28
  • …
  • 717
  • Next

Tim’s Other Projects

Dispatches from the Multiverse

Current Market Stats

Charts courtesy Altos Research
Real Estate Market Chart by Altos Research www.altosresearch.com

Real Estate Market Chart by Altos Research www.altosresearch.com

Real Estate Market Chart by Altos Research www.altosresearch.com

Real Estate Market Chart by Altos Research www.altosresearch.com

News Categories

  • News (1,253)
    • Local (223)
    • National (46)
    • International (1)
    • Audio & Video (60)
    • Humor (43)
    • Opinion (88)
    • Uncategorized (314)
  • Features (558)
  • Statistics (1,109)
    • Counties (724)
    • Neighborhoods (100)
  • Economy (74)
  • Extras (491)
    • Polls (381)
    • Flickr Group (1)
    • Announcements (38)
    • Administrative (78)

Archives

Tip Jar

Like what we're doing?

Drop us a tip!

Accounts

  • Log in
  • Entries feed
  • Comments feed
  • WordPress.org
©2024 Seattle Bubble | Built using WordPress and Responsive Blogily theme by Superb