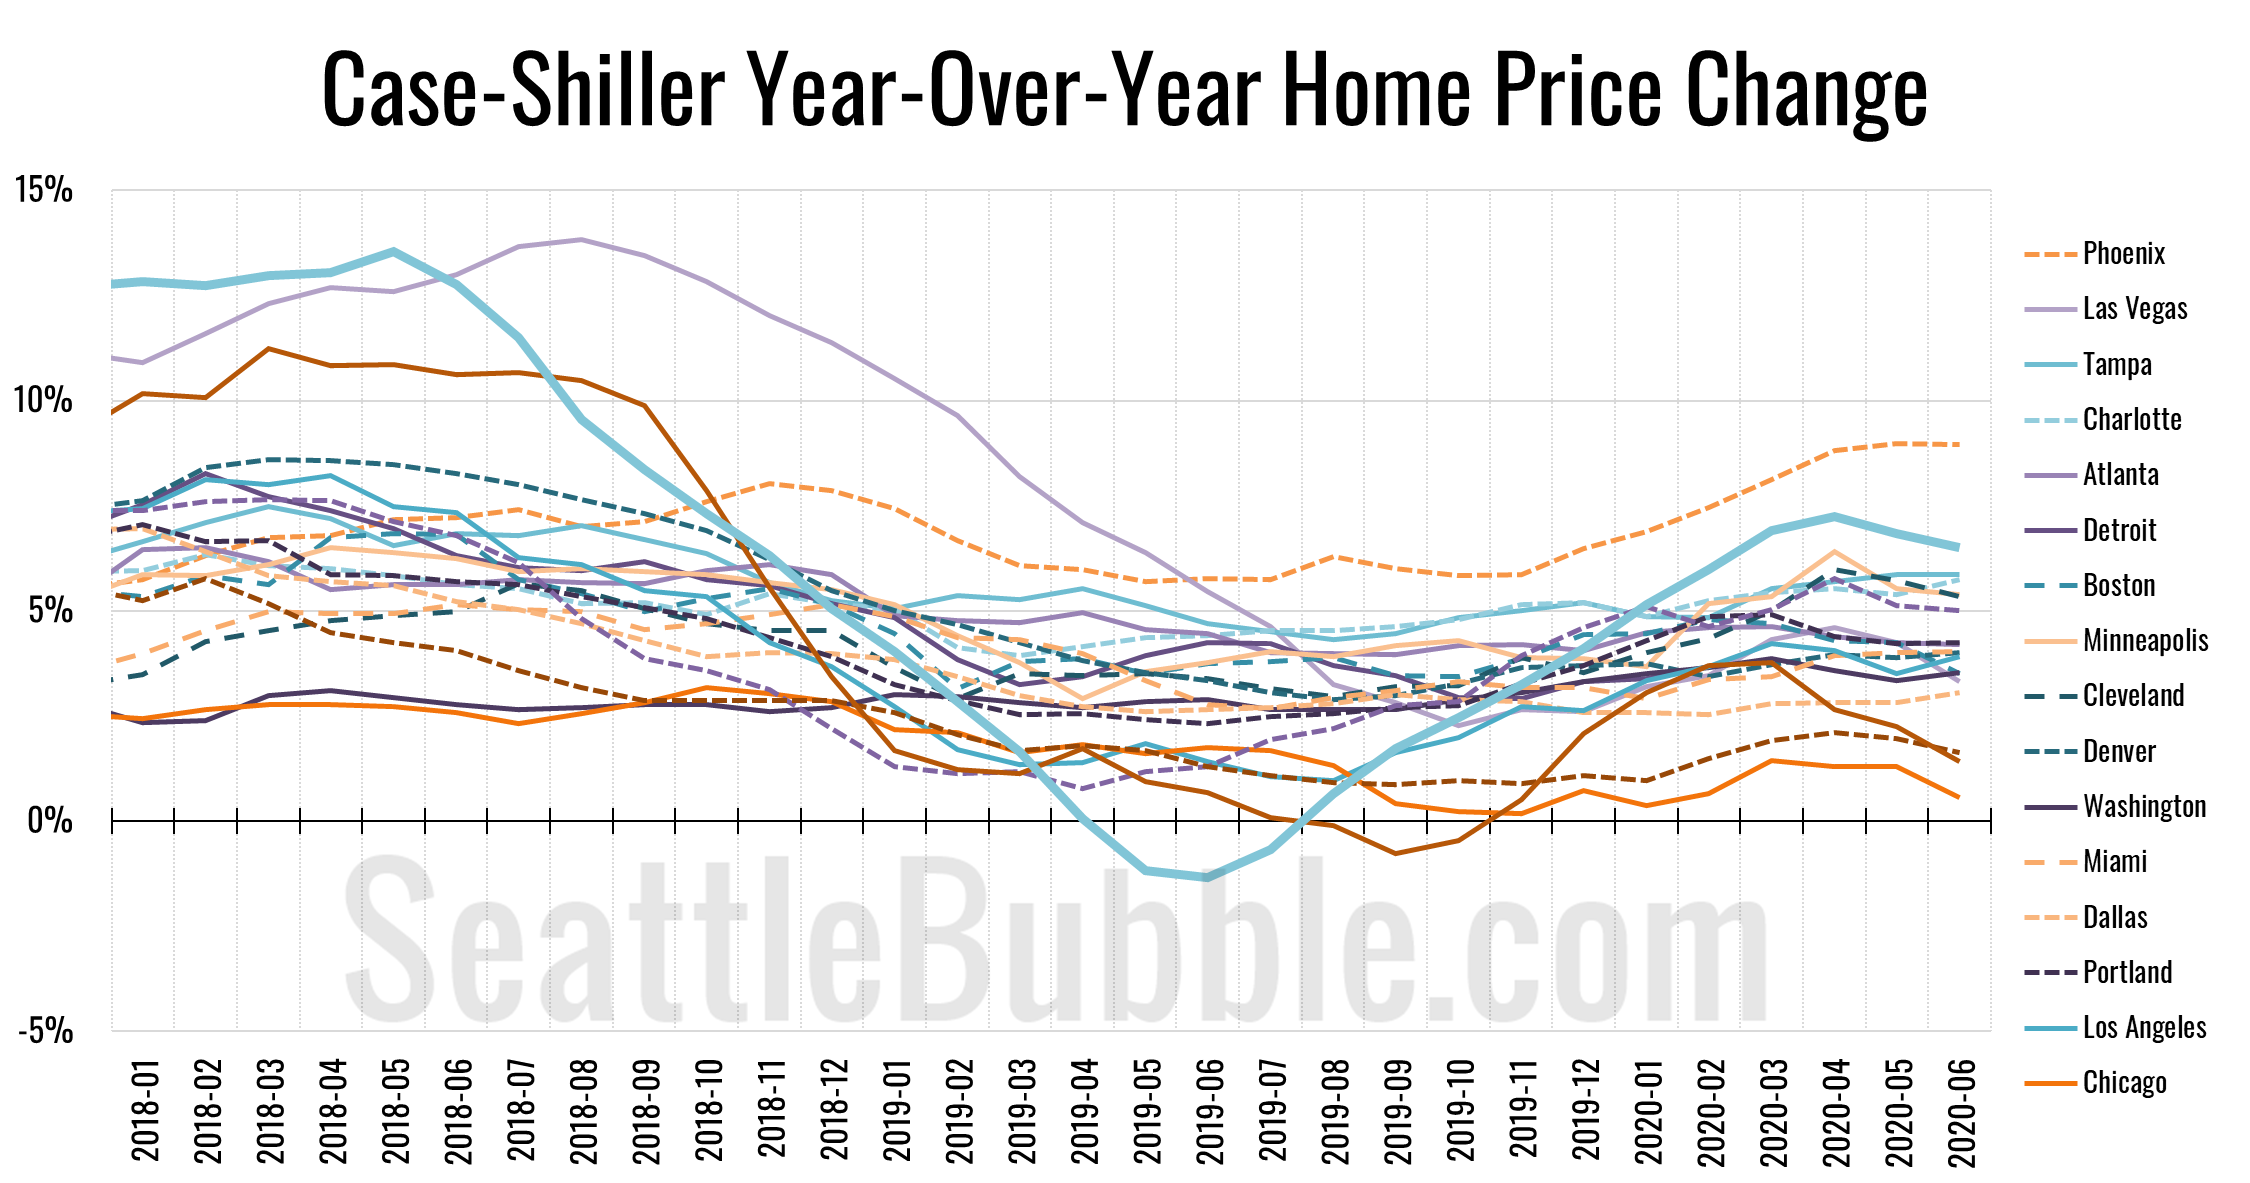
Let’s catch up a bit on our Case-Shiller data. According to June data that was released this week, Seattle-area home prices were up 0.2 percent May to June and up 6.5 percent YOY…
local real estate news, statistics, and commentary without the sales spin.
Let’s catch up a bit on our Case-Shiller data. According to June data that was released this week, Seattle-area home prices were up 0.2 percent May to June and up 6.5 percent YOY…
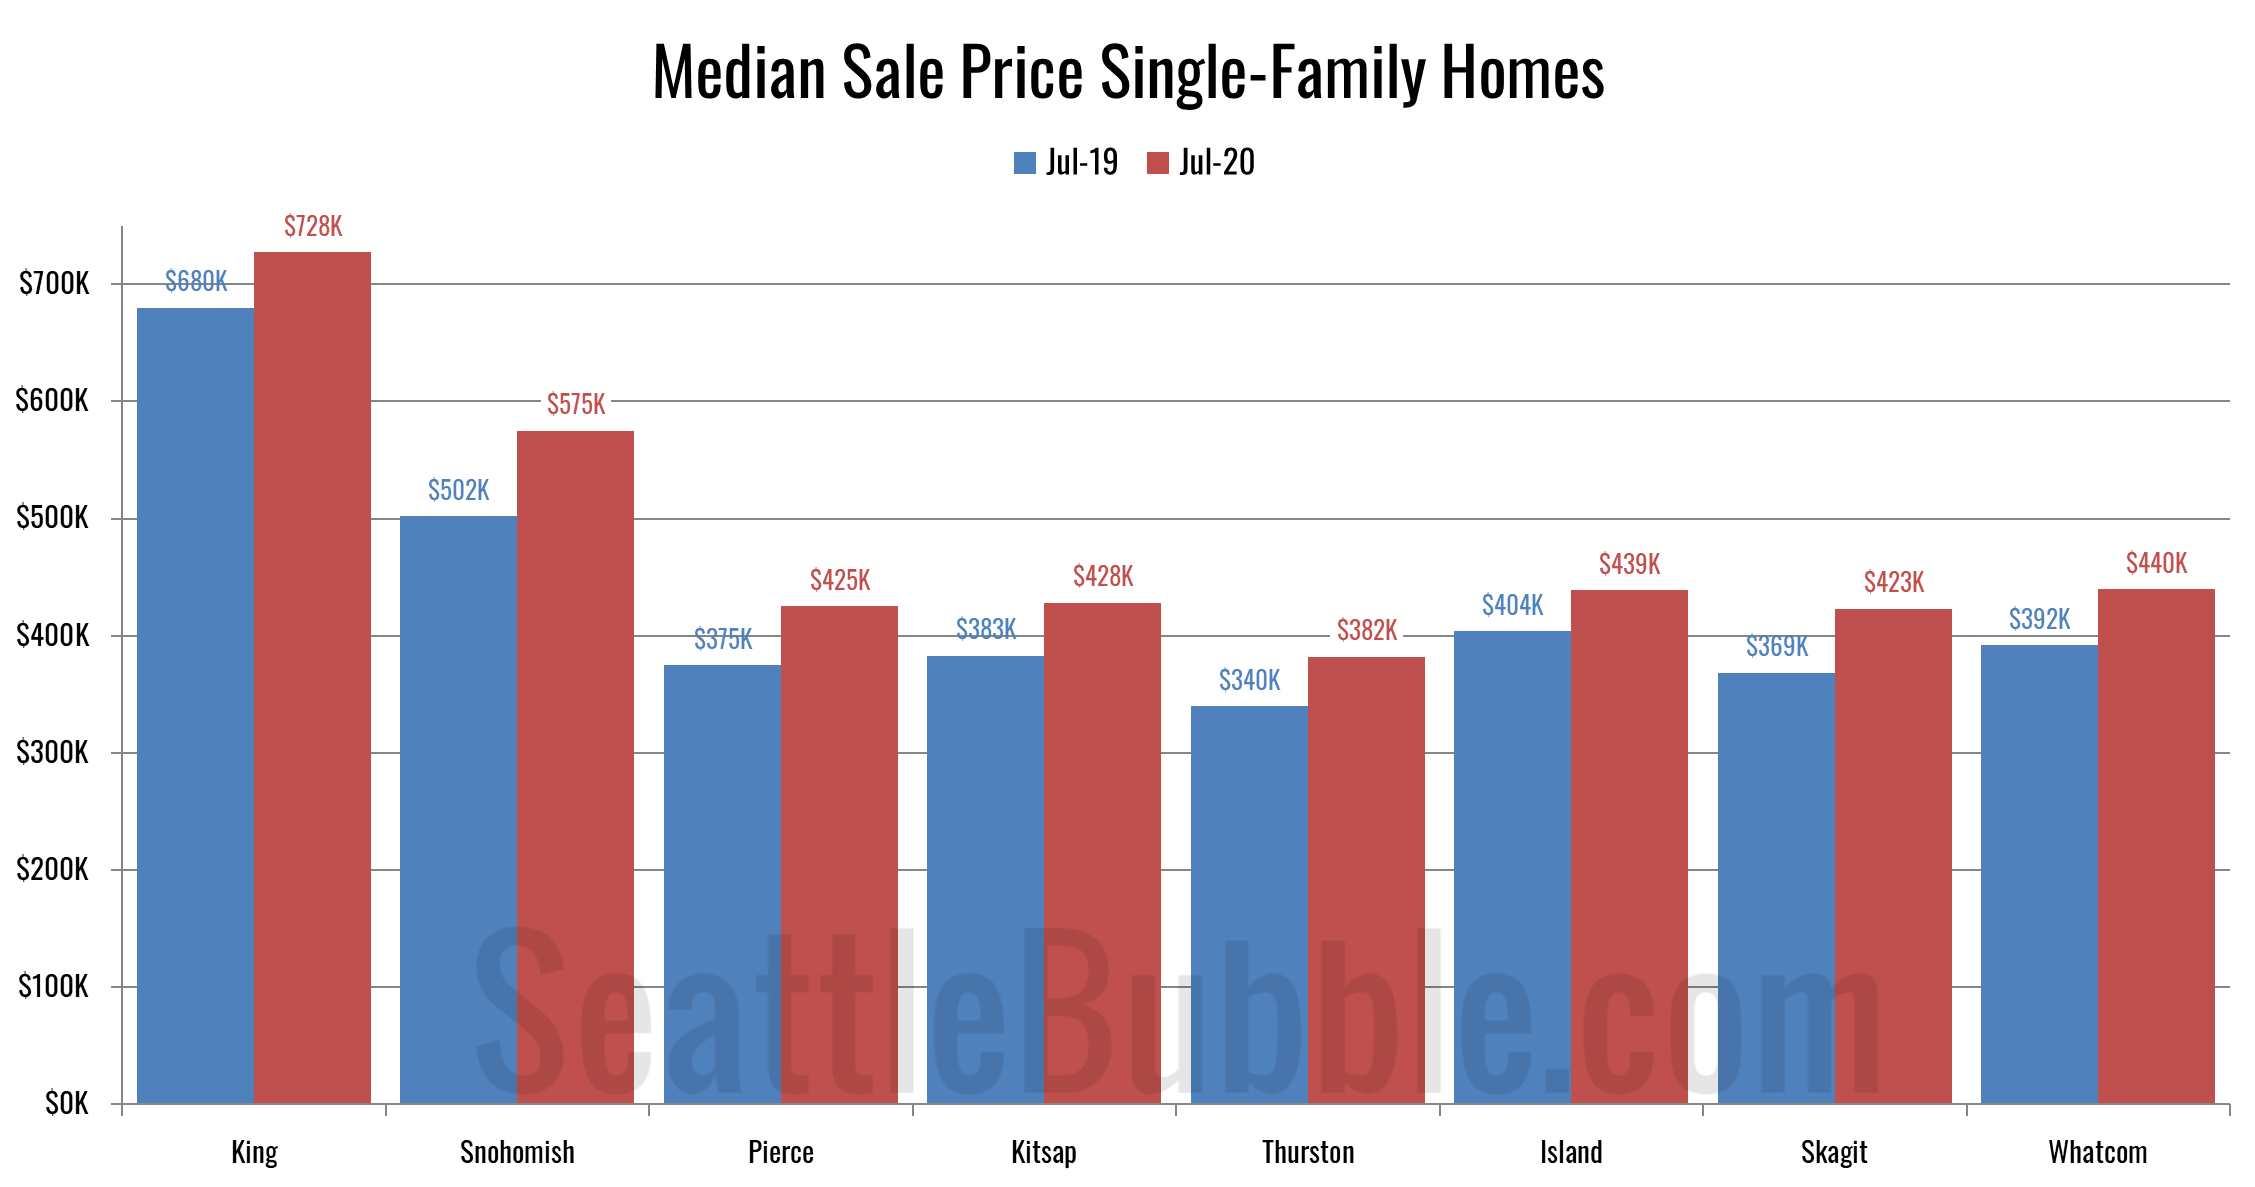
Okay, let’s get back to the data. It’s about time. Okay, it’s way past time. Anyway, whatever. Here’s some data. Since it’s been a while, let’s start with a few high-level stats from around the Puget Sound…
Hoping to come back to life soon…
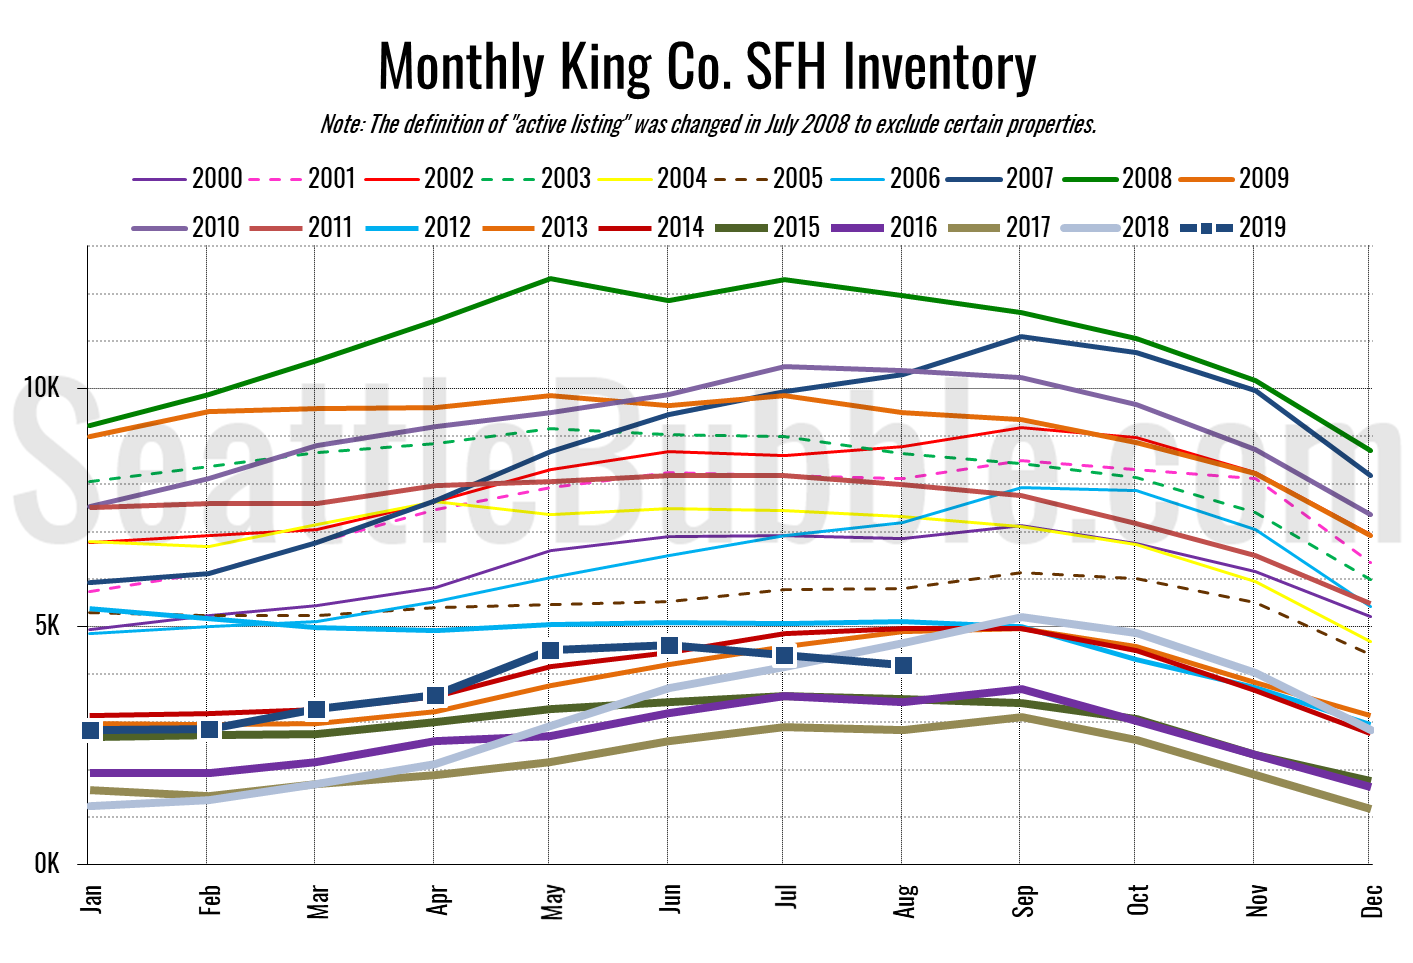
The NWMLS published their August stats yesterday, so let’s take a look at how the month shook out for the housing market.
As we mentioned in yesterday’s preview post, the biggest story is a sudden, renewed shortage of inventory.
Before we get into our detailed monthly stats, here’s a quick look at their press release…
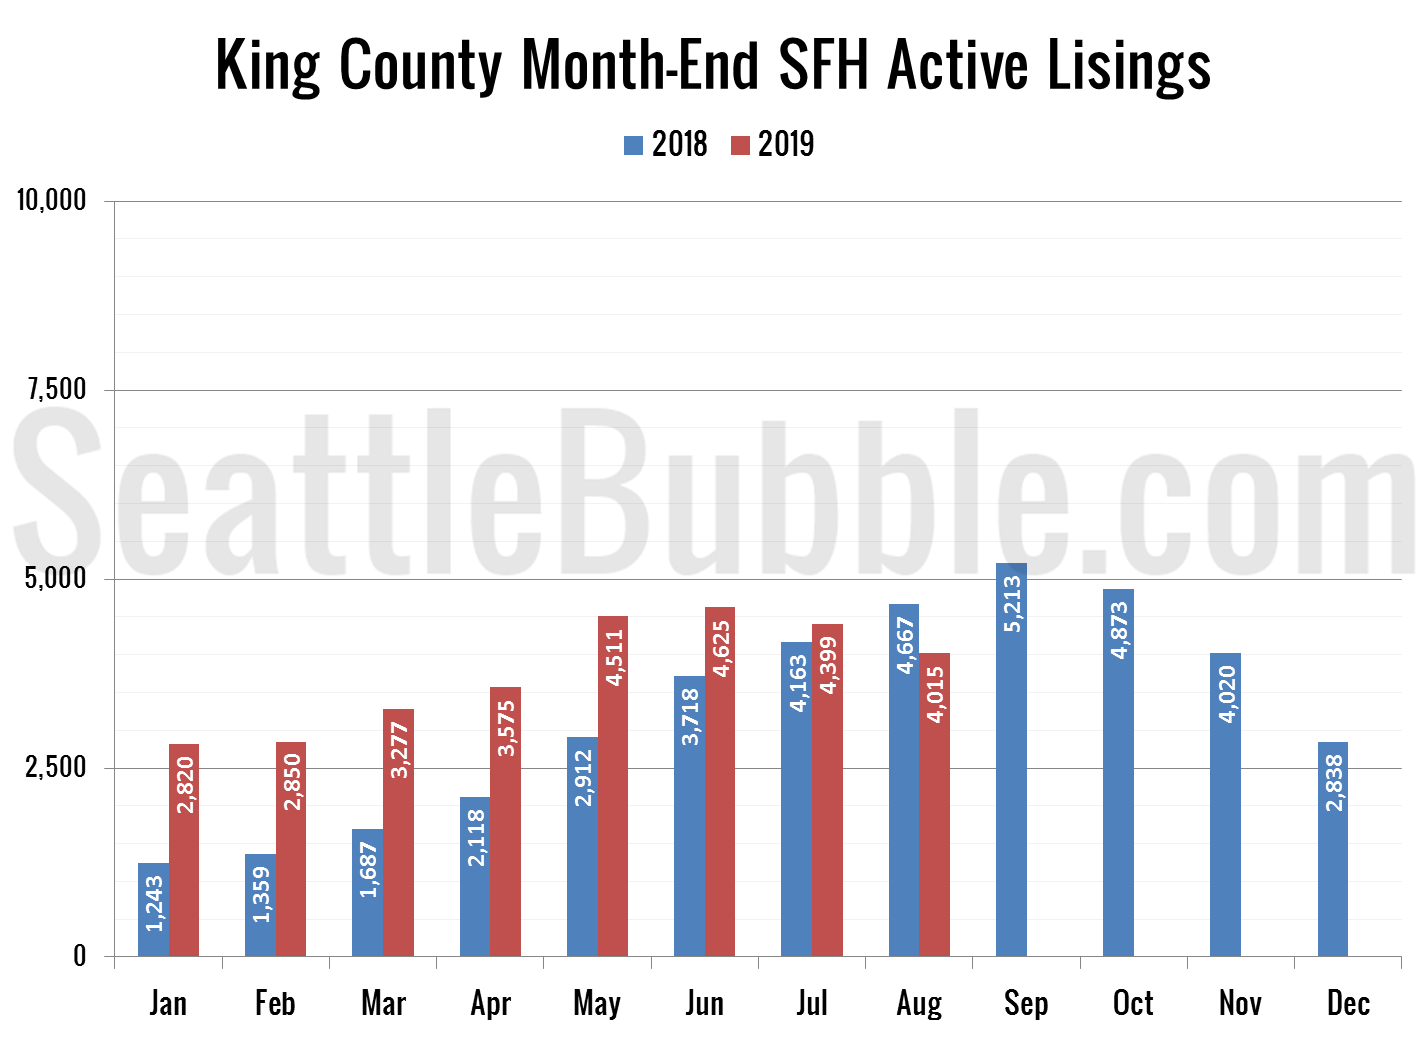
NWMLS stats for August are due any day now, probably later today, but let’s have a look at our “early” view on the August housing market stats for the Seattle area.
The biggest news: Active listings appear to be down considerably from a year ago. This is a big flip from earlier this year, when listings were way up, and definitely not great news for buyers.