Skip to content

Seattle Bubble

local real estate news, statistics, and commentary without the sales spin.

Menu
  • Home
  • About
  • Contact
  • Reference
  • Speaking
Menu

Case-Shiller: Seattle-Area Home Prices Flat in April

Posted on July 8, 2019 by The Tim

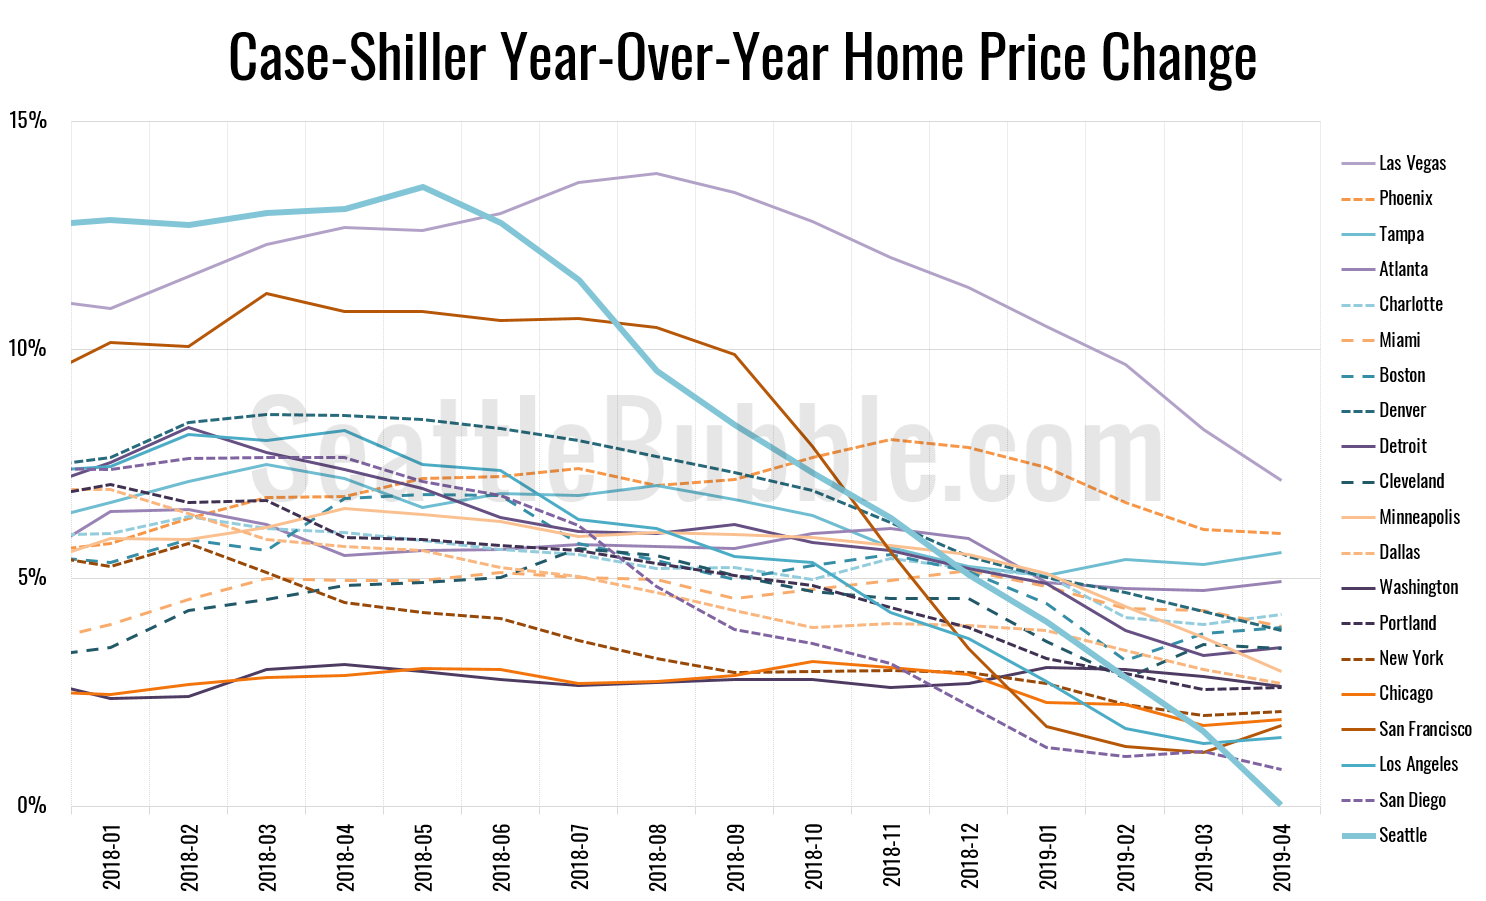
Let’s play a bit of catch-up today with some stats that I’ve allowed to fall behind. First up, the latest Case-Shiller data from a couple weeks ago. According to April data that was released late June, Seattle-area home prices were:

Up 1.1 percent March to April
Up less than 0.1 percent YOY.
Up 30.9 percent from the July 2007 peak

Last year at this time prices were up 2.7 percent month-over-month and year-over-year prices were up 13.1 percent.
Read the full post…

Share:

  • Share on X (Opens in new window) X
  • Share on LinkedIn (Opens in new window) LinkedIn
  • Share on Facebook (Opens in new window) Facebook
  • Share on Reddit (Opens in new window) Reddit
  • Share on Pinterest (Opens in new window) Pinterest
  • Email a link to a friend (Opens in new window) Email

NWMLS: Listings up, sales flat, prices fall in May

Posted on June 6, 2019June 7, 2019 by The Tim

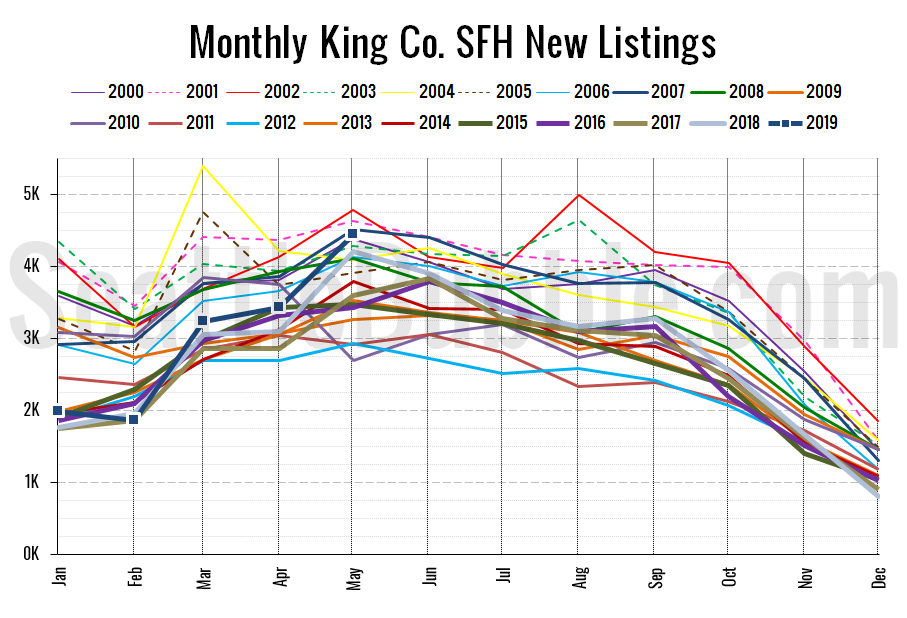
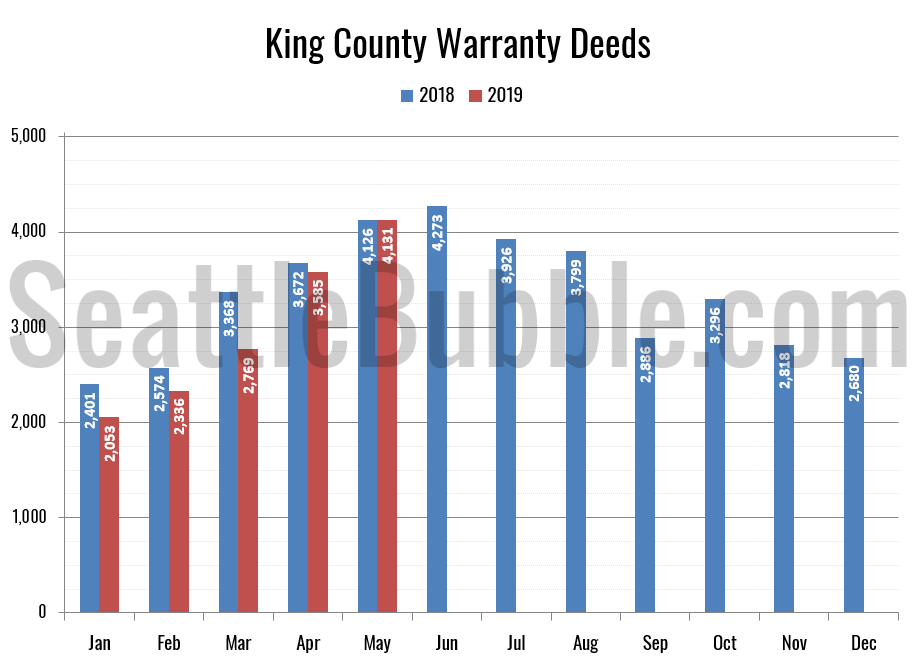
The NWMLS published their May stats today, so let’s take a look at how the month shook out for the housing market. The King County median price of single-family homes was down year-over-year in May, the third month in a row of declines. Inventory was up from a year ago again, but the as we mentioned in the preview post earlier this week, the rate of increase is rapidly declining from the all-time high set in December. Pending and closed sales are increasing, but only modestly.

Read the full post…

Share:

  • Share on X (Opens in new window) X
  • Share on LinkedIn (Opens in new window) LinkedIn
  • Share on Facebook (Opens in new window) Facebook
  • Share on Reddit (Opens in new window) Reddit
  • Share on Pinterest (Opens in new window) Pinterest
  • Email a link to a friend (Opens in new window) Email

May Stats Preview: Not Dead Yet Edition!

Posted on June 3, 2019June 3, 2019 by The Tim

Remember, you can always get access to the Seattle Bubble spreadsheets by supporting my ongoing work as a member of Seattle Bubble. Hey look who it is. That Seattle Bubble guy. He’s not gone after all. Seriously though, everything is fine. Things just got a bit busy. Let’s have a look at the May stats,…

Read the full post…

Share:

  • Share on X (Opens in new window) X
  • Share on LinkedIn (Opens in new window) LinkedIn
  • Share on Facebook (Opens in new window) Facebook
  • Share on Reddit (Opens in new window) Reddit
  • Share on Pinterest (Opens in new window) Pinterest
  • Email a link to a friend (Opens in new window) Email

Cheapest parts of King County still make up the largest share of sales, even as prices there grow the most

Posted on April 10, 2019April 10, 2019 by The Tim

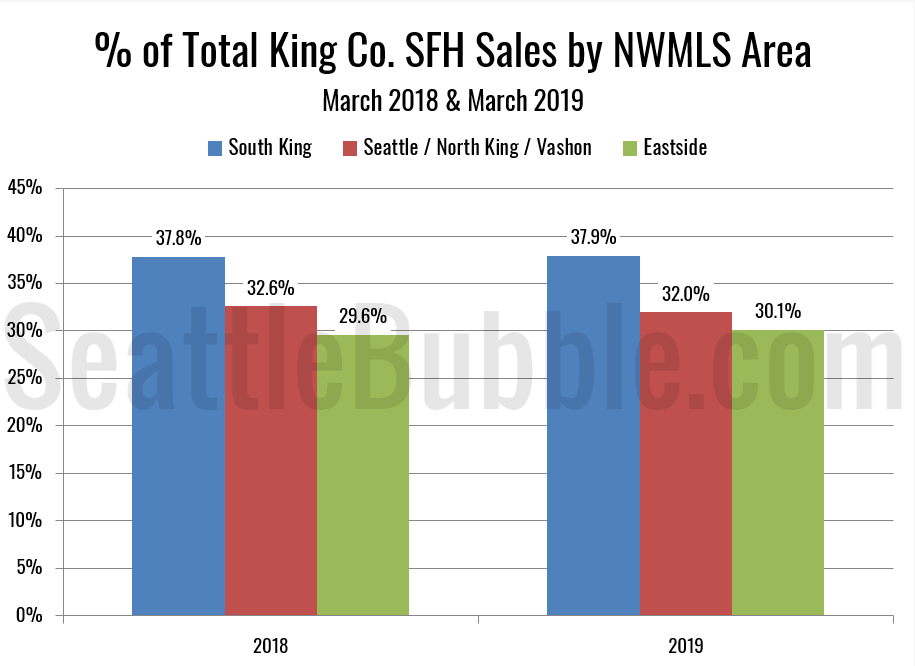
It’s been a few months since we took a look at the in-county breakdown data from the NWMLS to see how the sales mix shifted around the county. I like to keep an eye on this not only to see how individual neighborhoods are doing but also to see how the sales mix shift affects the overall county-wide median price.

As of March, prices are up from a year ago in the low-end regions, flat in the mid-range regions, and down in the high-end regions. Meanwhile, the share of sales is tilting toward the low-end regions…

Read the full post…

Share:

  • Share on X (Opens in new window) X
  • Share on LinkedIn (Opens in new window) LinkedIn
  • Share on Facebook (Opens in new window) Facebook
  • Share on Reddit (Opens in new window) Reddit
  • Share on Pinterest (Opens in new window) Pinterest
  • Email a link to a friend (Opens in new window) Email

Around the Sound: Inventory up, sales down across the board

Posted on April 8, 2019 by The Tim

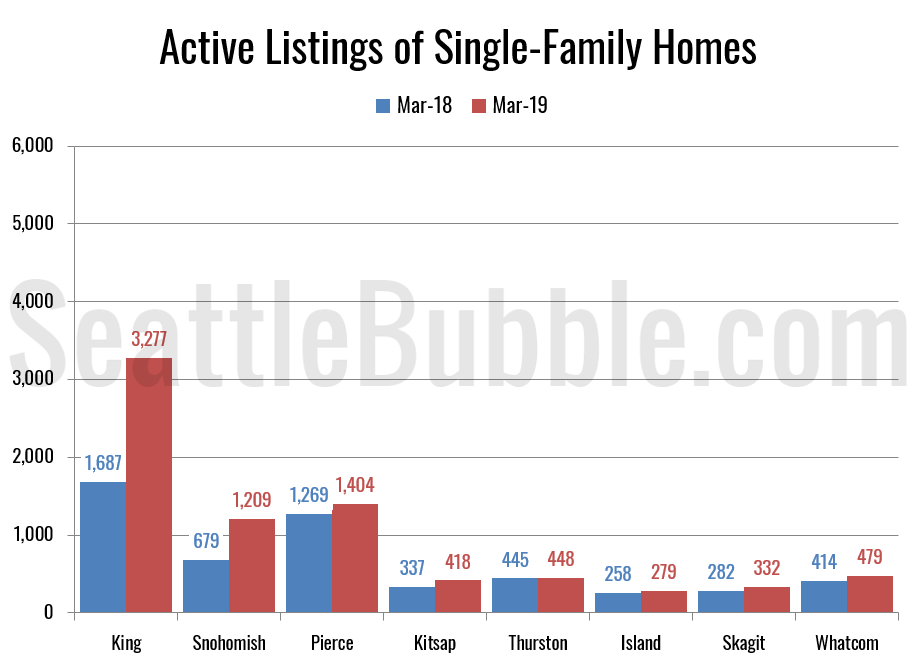
It’s been a few months since we had a look at the stats in the broader Puget Sound area, so let’s update our charts through March. Here’s the latest update to our “Around the Sound” statistics for King, Snohomish, Pierce, Kitsap, Thurston, Island, Skagit, and Whatcom counties.

King County still has some of the most dramatic changes, as the only county with a drop in the median price and by far the biggest increase in active listings. That said, active listings are up and closed sales are down across the board. Skagit, Kitsap, Pierce, and Thurston all still saw double-digit year-over-year declines in sales…

Read the full post…

Share:

  • Share on X (Opens in new window) X
  • Share on LinkedIn (Opens in new window) LinkedIn
  • Share on Facebook (Opens in new window) Facebook
  • Share on Reddit (Opens in new window) Reddit
  • Share on Pinterest (Opens in new window) Pinterest
  • Email a link to a friend (Opens in new window) Email

Posts pagination

  • Previous
  • 1
  • …
  • 3
  • 4
  • 5
  • 6
  • 7
  • 8
  • 9
  • …
  • 717
  • Next

Tim’s Other Projects

Dispatches from the Multiverse

Current Market Stats

Charts courtesy Altos Research
Real Estate Market Chart by Altos Research www.altosresearch.com

Real Estate Market Chart by Altos Research www.altosresearch.com

Real Estate Market Chart by Altos Research www.altosresearch.com

Real Estate Market Chart by Altos Research www.altosresearch.com

News Categories

  • News (1,255)
    • Local (223)
    • National (46)
    • International (1)
    • Audio & Video (60)
    • Humor (43)
    • Opinion (90)
    • Uncategorized (314)
  • Features (558)
  • Statistics (1,109)
    • Counties (724)
    • Neighborhoods (100)
  • Economy (74)
  • Extras (491)
    • Polls (381)
    • Flickr Group (1)
    • Announcements (38)
    • Administrative (78)

Archives

Tip Jar

Like what we're doing?

Drop us a tip!

Accounts

  • Log in
  • Entries feed
  • Comments feed
  • WordPress.org
©2026 Seattle Bubble | Built using WordPress and Responsive Blogily theme by Superb