Skip to content

Seattle Bubble

local real estate news, statistics, and commentary without the sales spin.

Menu
  • Home
  • About
  • Contact
  • Reference
  • Speaking
Menu

Around the Sound: King County alone in price drops and big inventory gains

Posted on July 10, 2019July 10, 2019 by The Tim

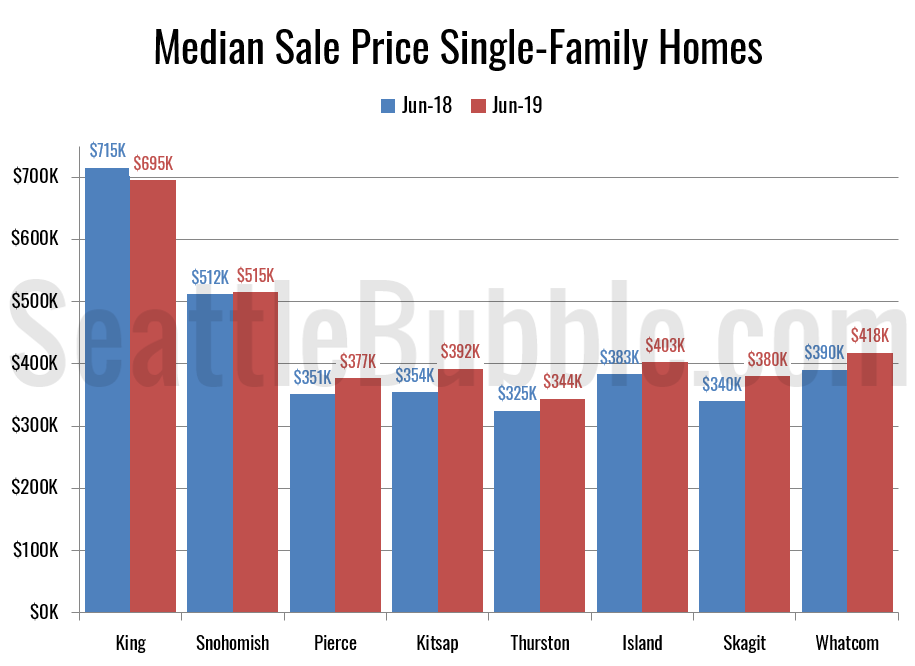
I promised an updated look at June data for the outlying counties, so let’s have a look at that. Here’s the latest update to our “Around the Sound” statistics for King, Snohomish, Pierce, Kitsap, Thurston, Island, Skagit, and Whatcom counties.

King County is the only place where prices are declining, and it also has the largest increase in active listings compared to a year ago. On the flip side, pending sales were up the most in King County, and it had one of the smallest declines in closed sales (sales rose in Skagit though). In most of the other Puget Sound counties, sales are declining, and listings are either falling or not increasing by much, and prices are rising.
Read the full post…

Share:

  • Share on X (Opens in new window) X
  • Share on LinkedIn (Opens in new window) LinkedIn
  • Share on Facebook (Opens in new window) Facebook
  • Share on Reddit (Opens in new window) Reddit
  • Share on Pinterest (Opens in new window) Pinterest
  • Email a link to a friend (Opens in new window) Email

NWMLS: Home prices and sales stagnated in June

Posted on July 8, 2019July 9, 2019 by The Tim

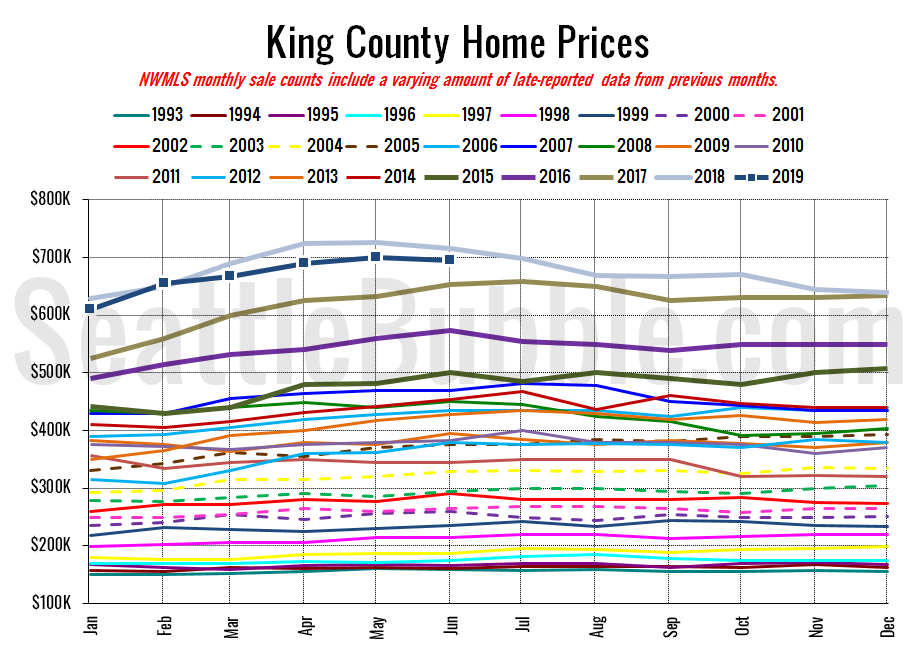
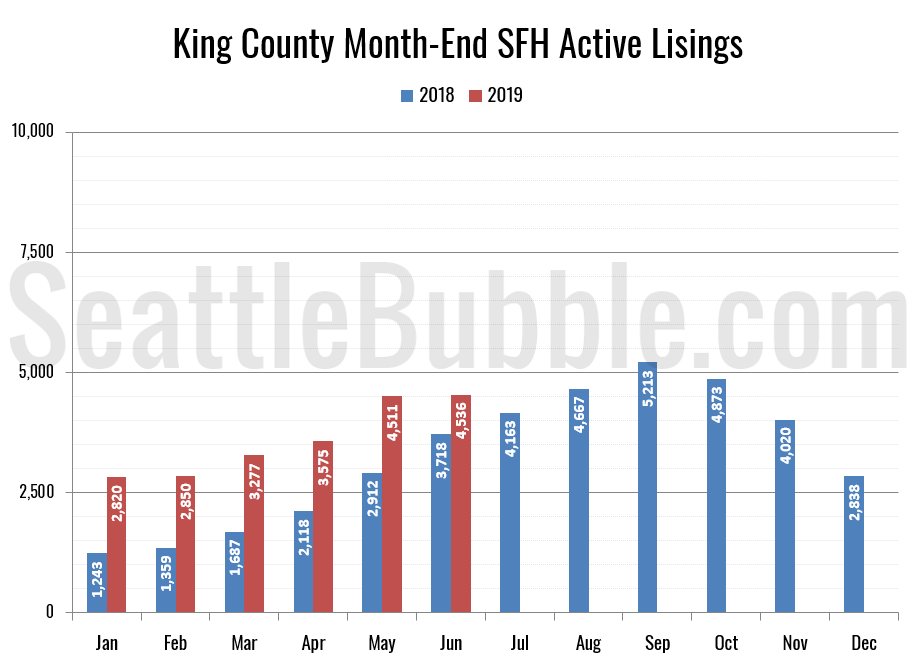
The NWMLS just published their June stats, so let’s take a look at how the month shook out for the housing market. The King County median price of single-family homes was down year-over-year again in June, the fourth month in a row of declines. Inventory was up from a year ago again, but the as we mentioned in the preview post earlier this morning, the rate of increase is rapidly declining from the all-time high set in December. Closed sales were down a bit from a year earlier, while pending sales were up slightly.

Read the full post…

Share:

  • Share on X (Opens in new window) X
  • Share on LinkedIn (Opens in new window) LinkedIn
  • Share on Facebook (Opens in new window) Facebook
  • Share on Reddit (Opens in new window) Reddit
  • Share on Pinterest (Opens in new window) Pinterest
  • Email a link to a friend (Opens in new window) Email

Stats Preview: Sales dipped in June as listings increase shrank further

Posted on July 8, 2019 by The Tim

This is the last post in today’s data catch-up marathon. I’ll also update a few more of the spreadsheets for members, and if the NWMLS posts their June data today I’ll try to get that up as well.

For now, let’s have a look at our “early” view on June stats.

In summary: Listings are still up from a year ago, but not by as much as they have been. Sales are down, but only just a bit.

Read the full post…

Share:

  • Share on X (Opens in new window) X
  • Share on LinkedIn (Opens in new window) LinkedIn
  • Share on Facebook (Opens in new window) Facebook
  • Share on Reddit (Opens in new window) Reddit
  • Share on Pinterest (Opens in new window) Pinterest
  • Email a link to a friend (Opens in new window) Email

Consumer Confidence has been stagnating, and fell in June

Posted on July 8, 2019 by The Tim

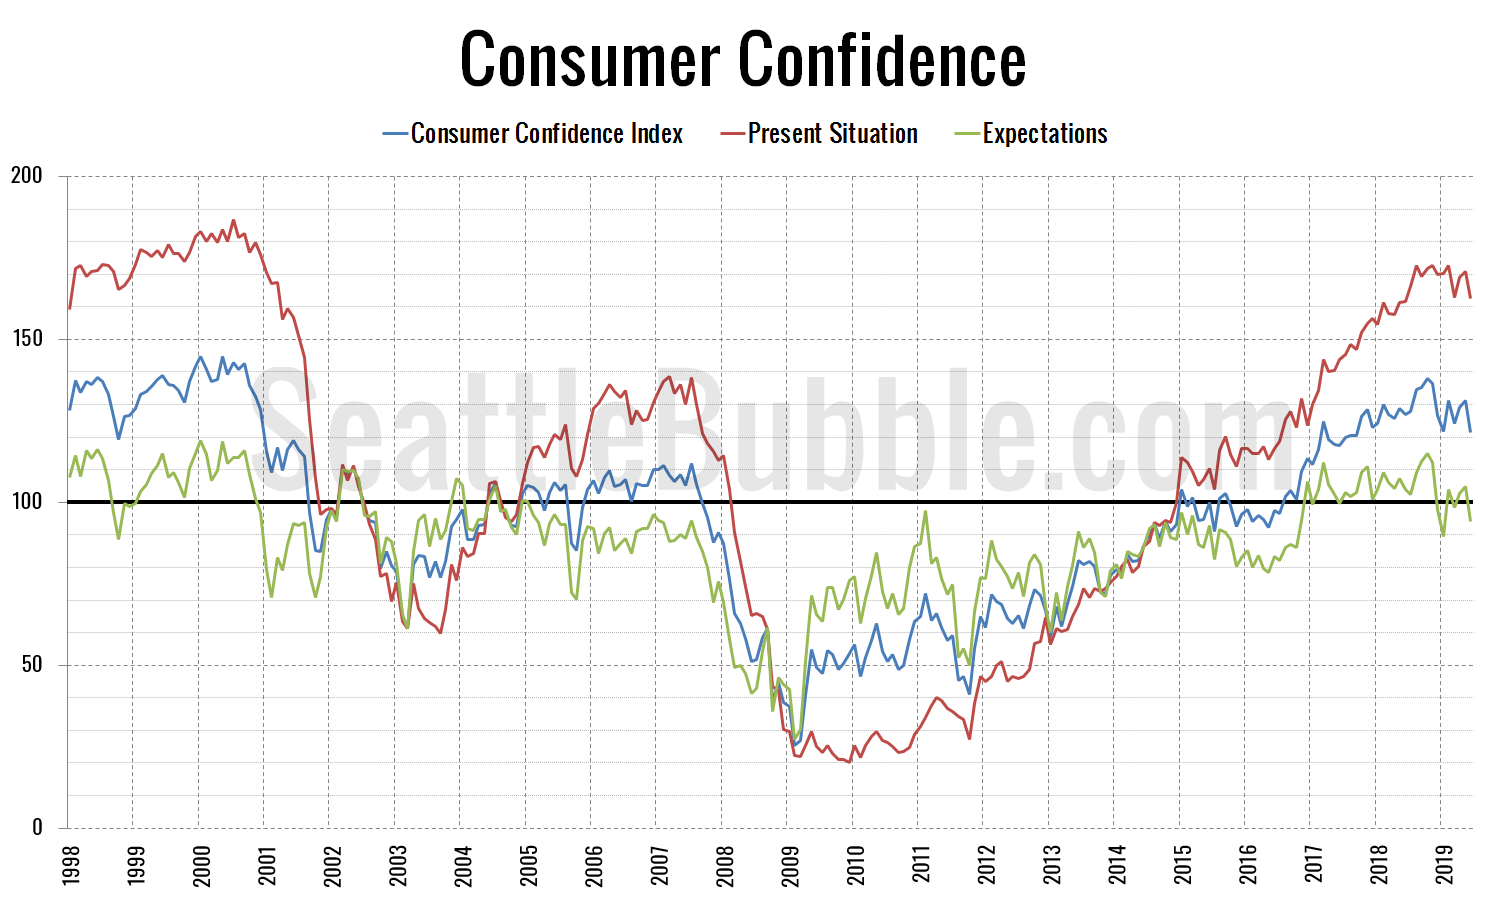
As part of our data catch-up extravaganza, let’s check in in on the latest data from the Consumer Confidence Index.

The overall Consumer Confidence Index currently sits at 121.5, down 7.5 percent in a month and down 4.4 percent from a year ago.

Read the full post…

Share:

  • Share on X (Opens in new window) X
  • Share on LinkedIn (Opens in new window) LinkedIn
  • Share on Facebook (Opens in new window) Facebook
  • Share on Reddit (Opens in new window) Reddit
  • Share on Pinterest (Opens in new window) Pinterest
  • Email a link to a friend (Opens in new window) Email

Case-Shiller Tiers: High Tier Price Drops Accelerate

Posted on July 8, 2019 by The Tim

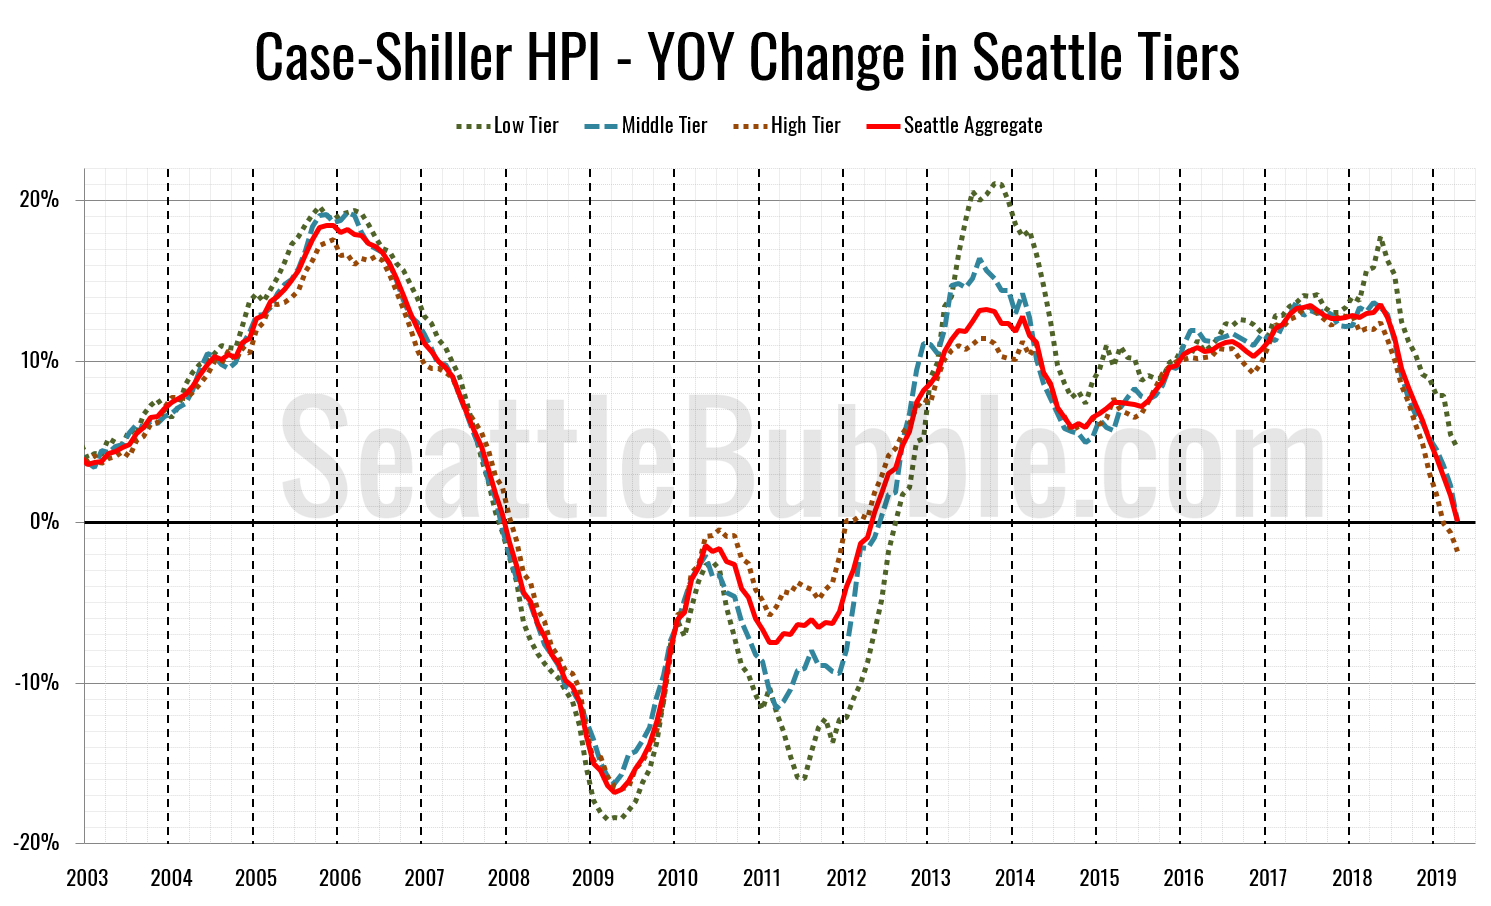
Let’s check out the three price tiers for the Seattle area, as measured by Case-Shiller. Remember, Case-Shiller’s “Seattle” data is based on single-family home repeat sales in King, Pierce, and Snohomish counties.

Year-over-year price growth is falling in all three tiers, with the high tier having flipped to year-over-year losses as of February.

Read the full post…

Share:

  • Share on X (Opens in new window) X
  • Share on LinkedIn (Opens in new window) LinkedIn
  • Share on Facebook (Opens in new window) Facebook
  • Share on Reddit (Opens in new window) Reddit
  • Share on Pinterest (Opens in new window) Pinterest
  • Email a link to a friend (Opens in new window) Email

Posts pagination

  • Previous
  • 1
  • 2
  • 3
  • 4
  • 5
  • 6
  • 7
  • 8
  • …
  • 717
  • Next

Tim’s Other Projects

Dispatches from the Multiverse

Current Market Stats

Charts courtesy Altos Research
Real Estate Market Chart by Altos Research www.altosresearch.com

Real Estate Market Chart by Altos Research www.altosresearch.com

Real Estate Market Chart by Altos Research www.altosresearch.com

Real Estate Market Chart by Altos Research www.altosresearch.com

News Categories

  • News (1,255)
    • Local (223)
    • National (46)
    • International (1)
    • Audio & Video (60)
    • Humor (43)
    • Opinion (90)
    • Uncategorized (314)
  • Features (558)
  • Statistics (1,109)
    • Counties (724)
    • Neighborhoods (100)
  • Economy (74)
  • Extras (491)
    • Polls (381)
    • Flickr Group (1)
    • Announcements (38)
    • Administrative (78)

Archives

Tip Jar

Like what we're doing?

Drop us a tip!

Accounts

  • Log in
  • Entries feed
  • Comments feed
  • WordPress.org
©2026 Seattle Bubble | Built using WordPress and Responsive Blogily theme by Superb