Skip to content

Seattle Bubble

local real estate news, statistics, and commentary without the sales spin.

Menu
  • Home
  • About
  • Contact
  • Reference
  • Speaking
Menu

December Stats Preview: Highest December listings since 2013

Posted on January 4, 2019January 4, 2019 by The Tim

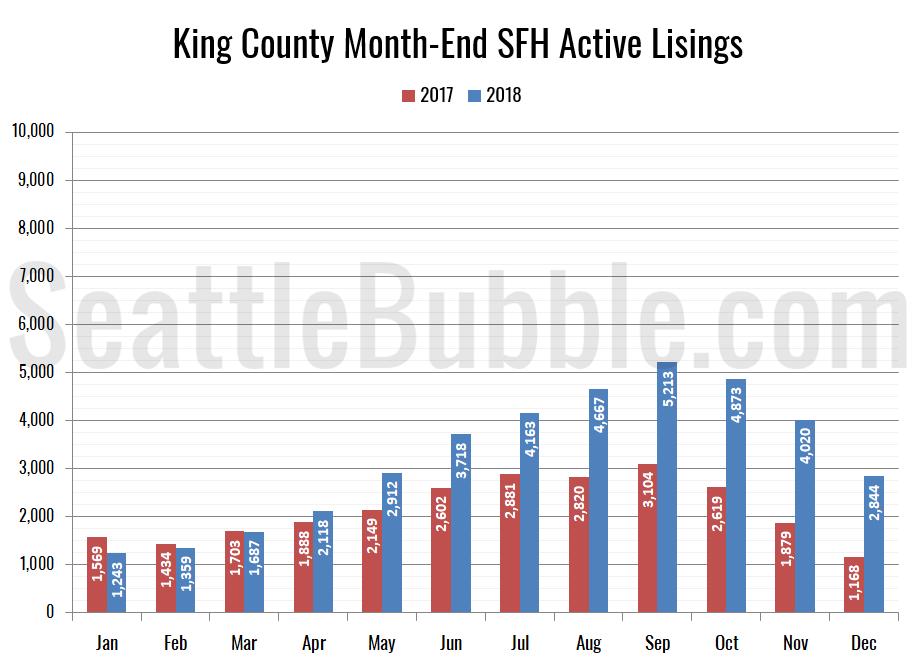
Now that 2018 is completely over, let’s take our first look at the December housing market stats for King and Snohomish counties.

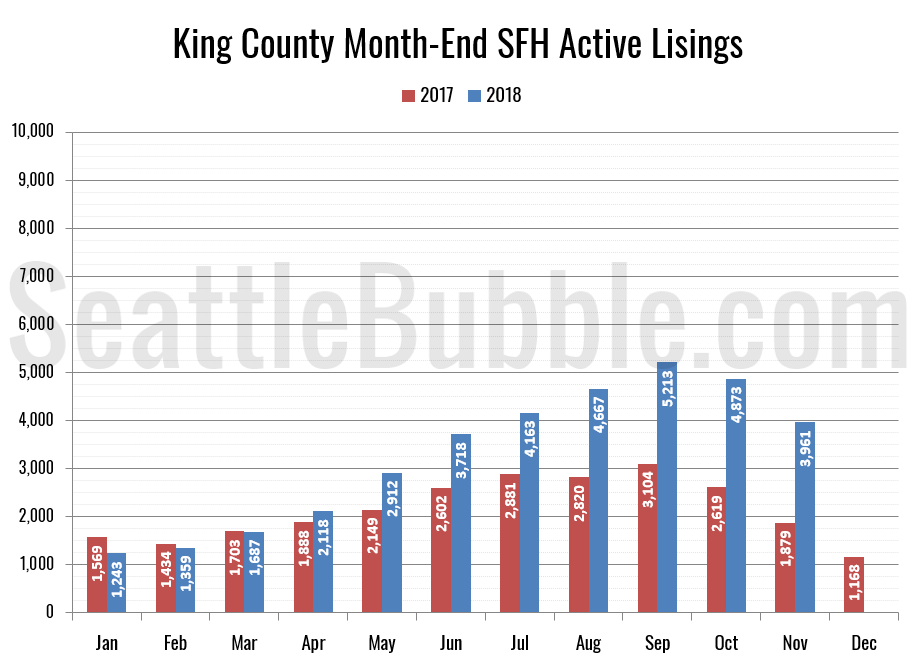
It’s pretty much the same story we’ve seen the past few months, which is good news for buyers: The number of home sales is falling and the number of homes on the market is climbing quite a bit. Foreclosures are still very rare…

Share:

  • Twitter
  • LinkedIn
  • Facebook
  • Reddit
  • Pinterest
  • Email

NWMLS: Home listing inventory skyrocketed in November as sales and prices both fell further

Posted on December 6, 2018December 6, 2018 by The Tim

November market stats were published by the NWMLS this morning. Home prices slipped to their lowest level since January, and inventory is declining seasonally but hit its highest November level since 2011. Both pending and closed sales continued to slip from last year as well. November’s year-over-year listing growth was an all-time record at a whopping 114 percent.

Share:

  • Twitter
  • LinkedIn
  • Facebook
  • Reddit
  • Pinterest
  • Email

November Stats Preview: Double the inventory, double the fun

Posted on December 5, 2018 by The Tim

It’s pretty much the same story as last month: Home sales volume was down considerably from a year ago and the number of homes on the market is up dramatically, nearly doubling from a year ago. Foreclosures are still very rare, although the number of notices did tick up a bit month-over-month.

Share:

  • Twitter
  • LinkedIn
  • Facebook
  • Reddit
  • Pinterest
  • Email

Case-Shiller: Seattle is #1! …for month-over-month price declines

Posted on November 27, 2018November 27, 2018 by The Tim

Let’s have a look at the latest data from the Case-Shiller Home Price Index. According to September data that was released today, Seattle-area home prices were:

Down 1.3 percent August to September
Up 8.4 percent YOY.
Up 30.2 percent from the July 2007 peak

Last year at this time prices were down 0.3 percent month-over-month and year-over-year prices were up 12.9 percent.

Share:

  • Twitter
  • LinkedIn
  • Facebook
  • Reddit
  • Pinterest
  • Email

NWMLS: Inventory up big from 2017, sales slip

Posted on November 6, 2018November 6, 2018 by The Tim

October market stats were published by the NWMLS today. Home prices were basically flat from September, and inventory dropped a bit but was up dramatically from 2017. Sales continued to slip from last year as well. September’s year-over-year listing growth was an all-time record at 68 percent, but October’s 86 percent blew that out of the water…

Share:

  • Twitter
  • LinkedIn
  • Facebook
  • Reddit
  • Pinterest
  • Email

Posts navigation

  • Previous
  • 1
  • …
  • 5
  • 6
  • 7
  • 8
  • 9
  • 10
  • 11
  • …
  • 717
  • Next

Tim’s Other Projects

Dispatches from the Multiverse

Current Market Stats

Charts courtesy Altos Research
Real Estate Market Chart by Altos Research www.altosresearch.com

Real Estate Market Chart by Altos Research www.altosresearch.com

Real Estate Market Chart by Altos Research www.altosresearch.com

Real Estate Market Chart by Altos Research www.altosresearch.com

News Categories

  • News (1,253)
    • Local (223)
    • National (46)
    • International (1)
    • Audio & Video (60)
    • Humor (43)
    • Opinion (88)
    • Uncategorized (314)
  • Features (558)
  • Statistics (1,109)
    • Counties (724)
    • Neighborhoods (100)
  • Economy (74)
  • Extras (491)
    • Polls (381)
    • Flickr Group (1)
    • Announcements (38)
    • Administrative (78)

Archives

Tip Jar

Like what we're doing?

Drop us a tip!

Accounts

  • Log in
  • Entries feed
  • Comments feed
  • WordPress.org
©2024 Seattle Bubble | Built using WordPress and Responsive Blogily theme by Superb